GWAS
Genome-wide association studies (GWAS) test hundreds of thousands of genetic variants across many genomes to find those statistically associated with a specific trait or disease. This methodology has generated a myriad of robust associations for a range of traits and diseases, and the number of associated variants is expected to grow steadily as GWAS sample sizes increase. GWAS results have a range of applications, such as gaining insight into a phenotype’s underlying biology, estimating its heritability, calculating genetic correlations, making clinical risk predictions, informing drug development programmes and inferring potential causal relationships between risk factors and health outcomes.
Overview of steps for conducting GWAS
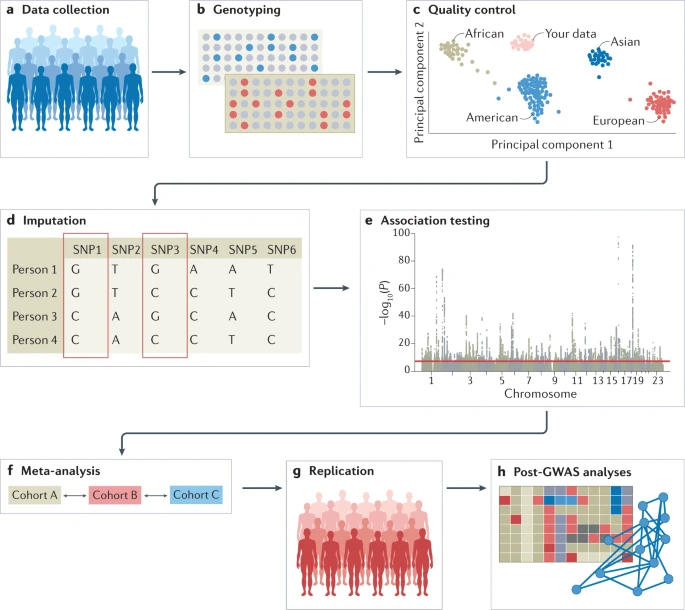
a) Data can be collected from study cohorts or available genetic and phenotypic information can be used from biobanks or repositories. Confounders need to be carefully considered and recruitment strategies must not introduce biases such as collider bias.
b) Genotypic data can be collected using microarrays to capture common variants, or next-generation sequencing methods for whole-genome sequencing (WGS) or whole-exome sequencing (WES).
c) Quality control (QC) includes steps at the wet-laboratory stage, such as genotype calling and DNA switches, and dry-laboratory stages on called genotypes, such as deletion of bad single-nucleotide polymorphisms (SNPs) and individuals, detection of population strata in the sample and principle component analysis (PCA). Figure depicts clustering of individuals according to genetic substrata.
d) Genotypic data can be phased, and untyped genotypes imputed using information from matched reference populations from repositories such as 1000 Genomes Project or TopMed. In this example, genotypes of SNP1 and SNP3 are imputed based on the directly assayed genotypes of other SNPs.
e) Genetic association tests are run for each genetic variant, using an appropriate model (for example, additive, non-additive, linear or logistic regression). Confounders are corrected for, including population strata, and multiple testing needs to be controlled. Output is inspected for unusual patterns and summary statistics are generated.
f) Results from multiple smaller cohorts are combined using standardized statistical pipelines.
g) Results can be replicated using internal replication or external replication in an independent cohort. For external replication, the independent cohort must be ancestrally matched and not share individuals or family members with the discovery cohort.
h) In silico analysis of genome-wide association studies (GWAS), using information from external resources. This can include in silico fine-mapping, SNP to gene mapping, gene to function mapping, pathway analysis, genetic correlation analysis, Mendelian randomization and polygenic risk prediction. After GWAS, functional hypotheses can be tested using experimental techniques such as CRISPR or massively parallel reporter assays, or results can be validated in a human trait/disease model.
Visualizing GWAS results
The primary output of a GWAS analysis is a list of P values, effect sizes and their directions generated from the association tests of all tested genetic variants with a phenotype of interest. These data are routinely visualized using Manhattan plot and quantile–quantile plot , generated using software tools such as R or web platforms such as FUMA or LocusZoom.
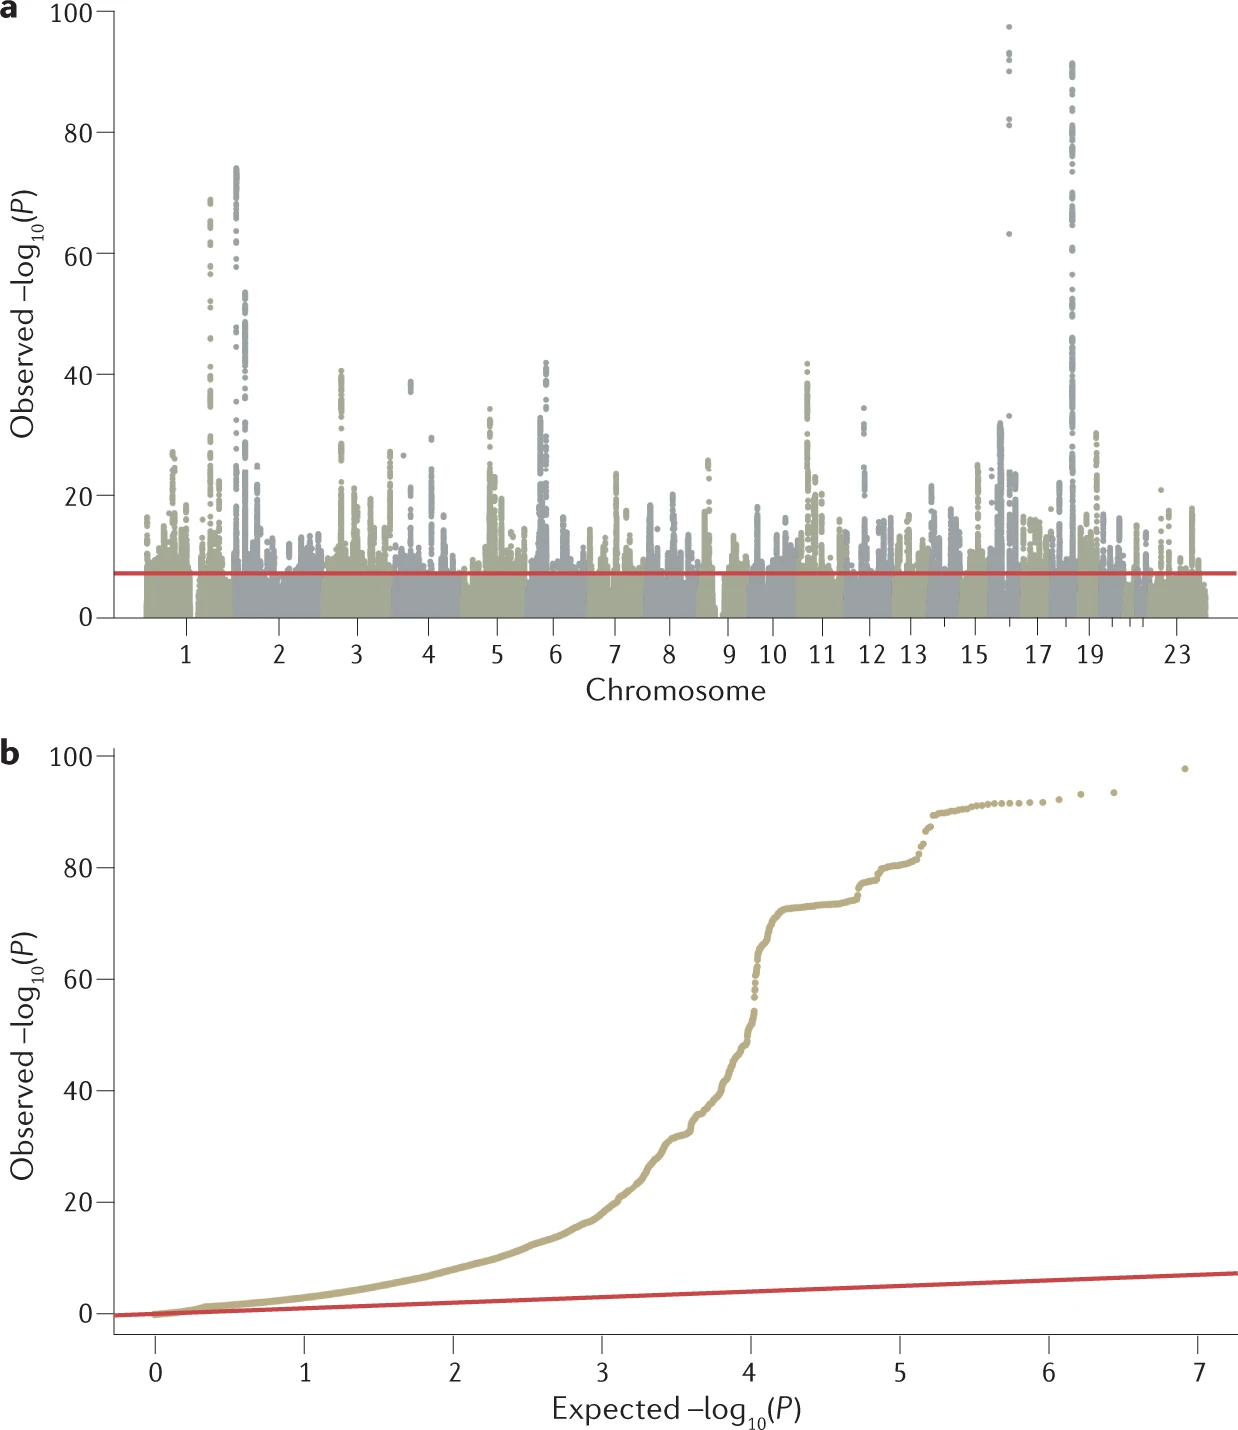
a) Manhattan plot showing significance of each variant’s association with a phenotype (body mass index in this case). Each dot represents a single-nucleotide polymorphism (SNP), with SNPs ordered on the x axis according to their genomic position. y axis represents strength of their association measured as –log10 transformed P values. Red line marks genome-wide significance threshold of P < 5 × 10⁻⁸.
b) Quantile–quantile plot showing distribution of expected P values under a null model of no significance versus observed P values. Expected –log10 transformed P values (x axis) for each association are plotted against observed values (y axis) to visualize the enrichment of association signal. Deviation from the expectation under the null hypothesis (red line) indicates the presence of either true causal effects or insufficiently corrected population stratification. In the case of true causal effects, one would expect to observe this deviation mostly at the right side of the plot, whereas population stratification causes the deviation to start closer to the origin. In this case, BMI is extremely polygenic and the genome-wide association study (GWAS) was highly powered, which may also cause the deviation to start close to the origin, making it difficult to visually spot stratification. LDSC may be used to assess whether this inflation is due to bias or polygenicity.
Functional follow-up of GWAS
Follow-up analysis of GWAS are needed to interpret the list of P values obtained in GWAS. Those follow-up analysis aim in determining the most likely causal variants, their functional interpretation and possible convergence in meaningful biological pathways.
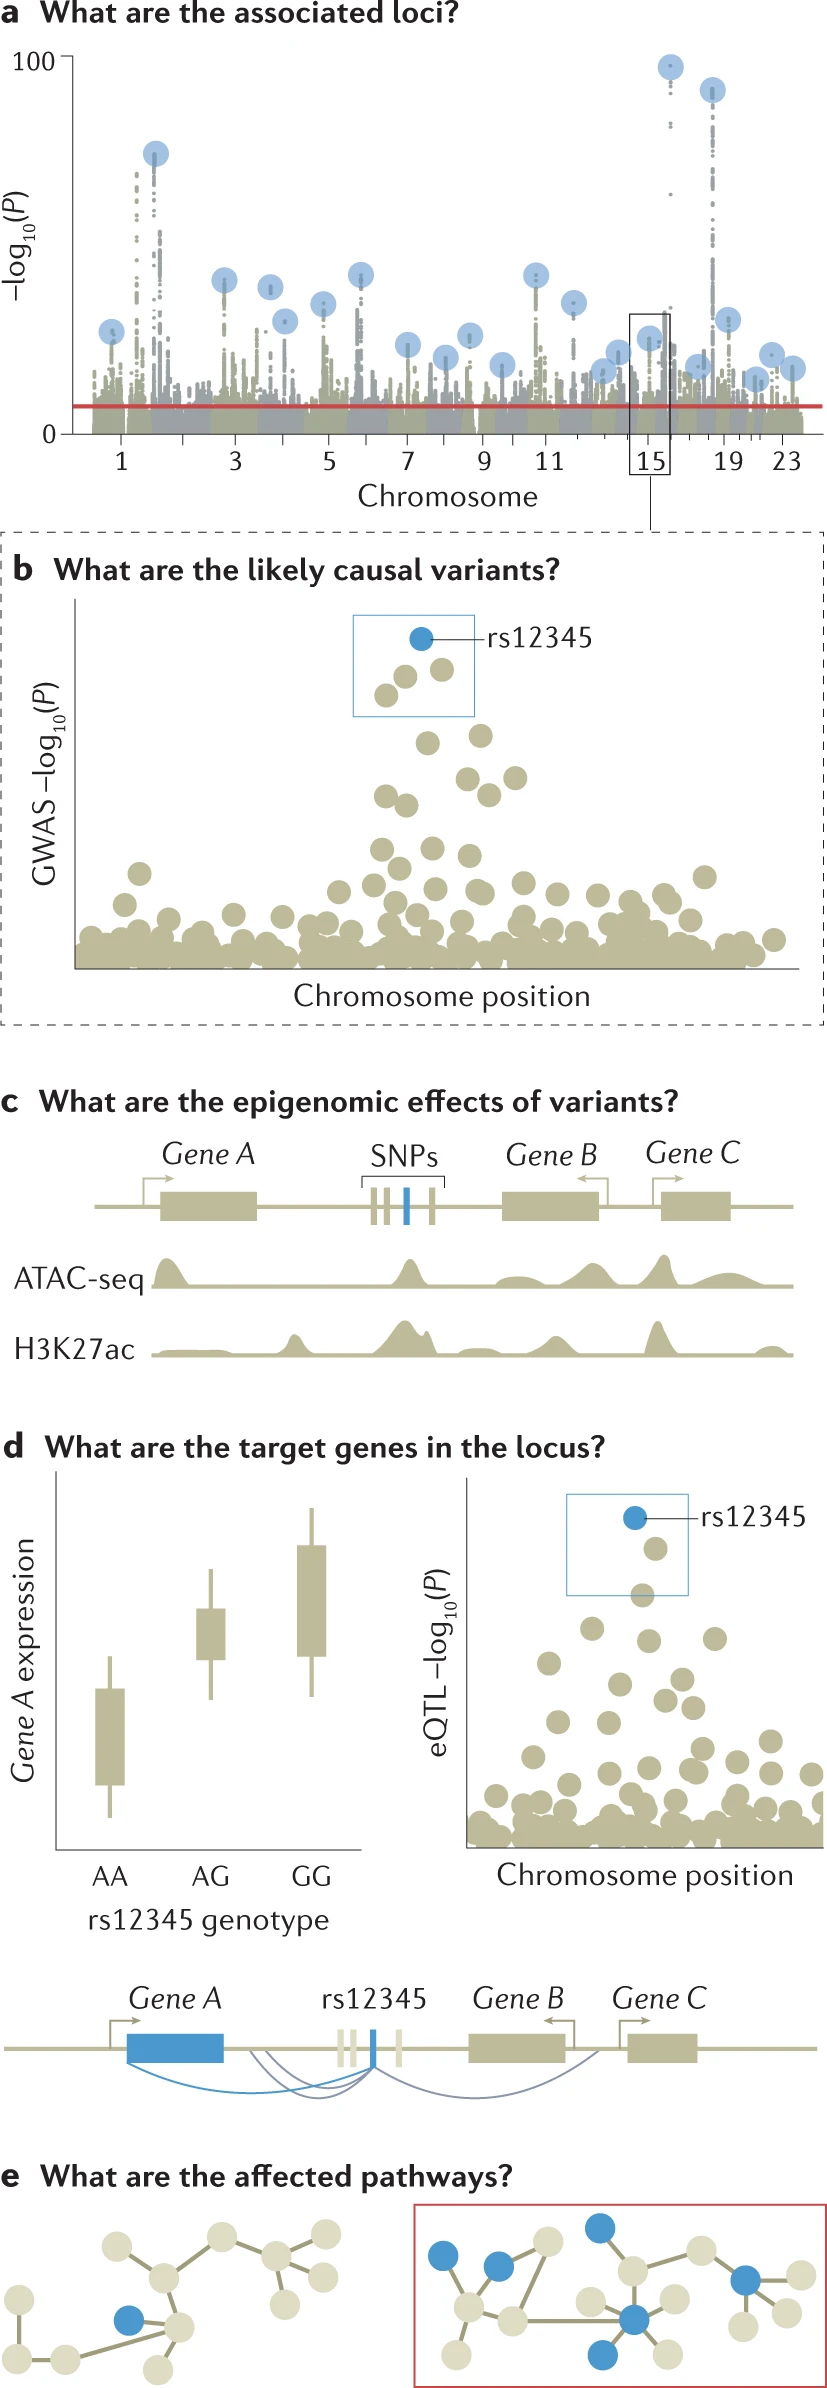
a) Genome-wide association studies (GWAS) are conducted to identify associated variants, often visualized as a Manhattan plot to show their genomic positions and strength of association.
b) To prioritize likely causal variants, statistical fine-mapping is applied to identify a set of variants that are likely to include the causal variant (blue box) as well as the most likely causal variant (rs12345; blue dot). Massively parallel reporter assays can be used to measure whether alleles differ in their ability to drive gene expression or other molecular activity for each variant (not shown).
c) Functional annotations of the genome can be integrated with GWAS data to identify epigenetic mechanisms that may be perturbed by the causal variant, including enhancers, promoters or other functional elements. Additional approaches include mapping molecular quantitative trait loci (molQTL) or in vitro assays (not shown). ATAC-Seq (assay for transposase-accessible chromatin with sequencing) is a popular method for determining chromatin accessibility across the genome. By sequencing regions of open chromatin, ATAC-Seq can help you uncover how chromatin packaging and other factors affect gene expression. H3K27me3 is an epigenetic modification to the DNA packaging protein Histone H3. It is a mark that indicates the tri-methylation of lysine 27 on histone H3 protein. This tri-methylation is associated with the downregulation of nearby genes via the formation of heterochromatic regions.
d) Target gene for a GWAS locus can be prioritized by mapping expression quantitative trait loci (eQTLs) (left) and their co-localization (right) to identify loci where the causal variant from GWAS is also a causal variant affecting gene expression. For GWAS variants in enhancers, high-throughput chromosome conformation capture (Hi-C) data and maps of enhancer target genes can be used together with simple prioritization by distance to identify genes affected by the causal variant (below).
e) To identify pathways whose perturbation may mediate the trait in question (red box), one can analyse the enrichment of multiple GWAS-implicated genes in predefined pathways. Additional approaches include trans-eQTL mapping and CRISPR perturbation of GWAS loci/genes followed by cellular phenotyping (not shown). For these analyses, the context of a relevant tissue, cell type and cell state needs to be carefully considered and analysed. ATAC-seq, assay for transposase-accessible chromatin using sequencing; H3K27Ac, histone H3 acetylated at K27; SNP, single-nucleotide polymorphism.
Missing heritability
Feasibility of identifying genetic variants by risk allele frequency and strength of genetic effect (odds ratio).
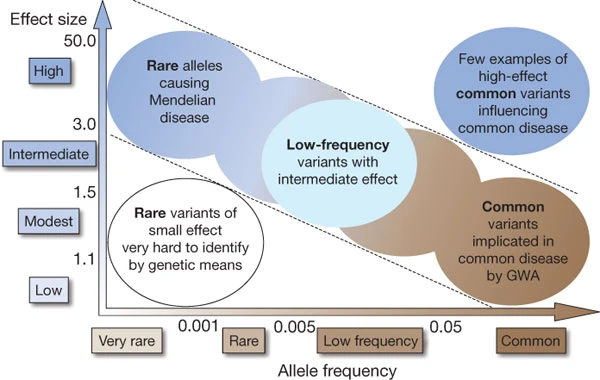
Genome-wide association studies have identified hundreds of genetic variants associated with complex human diseases and traits, and have provided valuable insights into their genetic architecture. Most variants identified so far confer relatively small increments in risk, and explain only a small proportion of familial clustering, leading many to question how the remaining, ‘missing’ heritability can be explained.
The underlying rationale for GWAS is the ‘common disease, common variant’ hypothesis, positing that common diseases are attributable in part to allelic variants present in more than 1–5% of the population. They have been facilitated by the development of commercial ‘SNP chips’ or arrays that capture most, although not all, common variation in the genome. Although the allelic architecture of some conditions, notably age-related macular degeneration, for the most part reflects the contributions of several variants of large effect (defined loosely here as those increasing disease risk by twofold or more), most common variants individually or in combination confer relatively small increments in risk (1.1–1.5-fold) and explain only a small proportion of heritability — the portion of phenotypic variance in a population attributable to additive genetic factors. For example, by 2009 at least 40 loci have been associated with human height, a classic complex trait with an estimated heritability of about 80%, yet they explain only about 5% of phenotypic variance despite studies of tens of thousands of people. Although disease-associated variants occur more frequently in protein-coding regions than expected from their representation on genotyping arrays, in which over-representation of common and functional variants may introduce analytical biases, the vast majority (>80%) of associated variants fall outside coding regions, emphasizing the importance of including both coding and non-coding regions in the search for disease-associated variants.
The questions arise as to why so much of the heritability is apparently unexplained by initial GWA findings, and why it is important. It is important because a substantial proportion of individual differences in disease susceptibility is known to be due to genetic factors, and understanding this genetic variation may contribute to better prevention, diagnosis and treatment of disease. It is important to recognize, however, that few investigators expected these studies immediately to find all of the variants associated with common diseases, or even most of them; the hope was that they would at least find some. Limitations in the design of early GWAS, such as imprecise phenotyping and the use of control groups of questionable comparability, may have reduced estimates of effect sizes while preserving some ability to identify associated variants. These studies have considerably surpassed early expectations, reproducibly identifying hundreds of variants in many dozens of traits, but for many traits they have explained only a small proportion of estimated heritability.
Many explanations for this missing heritability have been suggested, including much larger numbers of variants of smaller effect yet to be found; rarer variants (possibly with larger effects) that are poorly detected by available genotyping arrays that focus on variants present in 5% or more of the population; structural variants poorly captured by existing arrays; low power to detect gene–gene interactions; and inadequate accounting for shared environment among relatives. Consensus is lacking, however, on approaches and priorities for research to examine what has been termed ‘dark matter’ of genome-wide association—dark matter in the sense that one is sure it exists, can detect its influence, but simply cannot ‘see’ it (yet).
Much of the speculation about missing heritability from GWAS has focused on the possible contribution of variants of low minor allele frequency (MAF), defined here as roughly 0.5% < MAF < 5%, or of rare variants (MAF < 0.5%). Such variants are not sufficiently frequent to be captured by current GWA genotyping arrays, nor do they carry sufficiently large effect sizes to be detected by classical linkage analysis in family studies. Once MAF falls below 0.5%, detection of associations becomes unlikely unless effect sizes are very large, as in monogenic conditions. For modest effect sizes, association testing may require composite tests of overall ‘mutational load’, comparing frequencies of mutations of potentially similar functional effect in cases and controls.
Text and figures from: