PGS
A polygenic score (PGS) or polygenic risk score (PRS) is an estimate of an individual’s genetic liability to a trait or disease, calculated according to their genotype profile and relevant genome-wide association study (GWAS) data. While present PGSs typically explain only a small fraction of trait variance, their correlation with the single largest contributor to phenotypic variation—genetic liability—has led to the routine application of PGSs across biomedical research. Among a range of applications, PGSs are exploited to assess shared etiology between phenotypes, to evaluate the clinical utility of genetic data for complex disease and as part of experimental studies in which, for example, experiments are performed that compare outcomes (e.g., gene expression and cellular response to treatment) between individuals with low and high PGS values. As GWAS sample sizes increase and PGSs become more powerful, PGSs are set to play a key role in research and stratified medicine. However, despite the importance and growing application of PGSs, there are limited guidelines for performing PGS analyses, which can lead to inconsistency between studies and misinterpretation of results.
While genome-wide complex trait analysis, LD score regression and PGS can all be exploited to infer heritability and shared etiology among complex traits, PGS is the only approach that provides an estimate of genetic liability to a trait at the individual level. In the classic PGS method (commonly known as the clumping + thresholding i.e. C+T method), a polygenic risk score is calculated by computing the sum of risk alleles that an individual has, weighted by the risk allele effect sizes as estimated by a GWAS on the phenotype. The method involves computing PGSs based on a subset of partially independent (clumped) SNPs exceeding a specific GWAS association P value threshold. PGS values are computed in relation to a hypothetical individual with the non-effect allele at every SNP, and, thus, they provide only a relative (compared to other individuals) estimate of risk (or trait effect) rather than an absolute estimate.
As GWAS sample sizes increase, polygenic scores are likely to play a central role in the future of biomedical research and personalized medicine. However, the efficacy of their use will depend on the continued development of methods that exploit them, their proper analysis and appropriate interpretation and an understanding of their strengths and limitations.
The use of summary statistic data for the genotype effect size estimates distinguishes polygenic scores from phenotypic prediction approaches that exploit individual-level data only.
Note
The Polygenic Score (PGS) Catalog is an open database of polygenic scores and the relevant metadata required for accurate application and evaluation.
Overview of the steps necessary for calculating PGSs
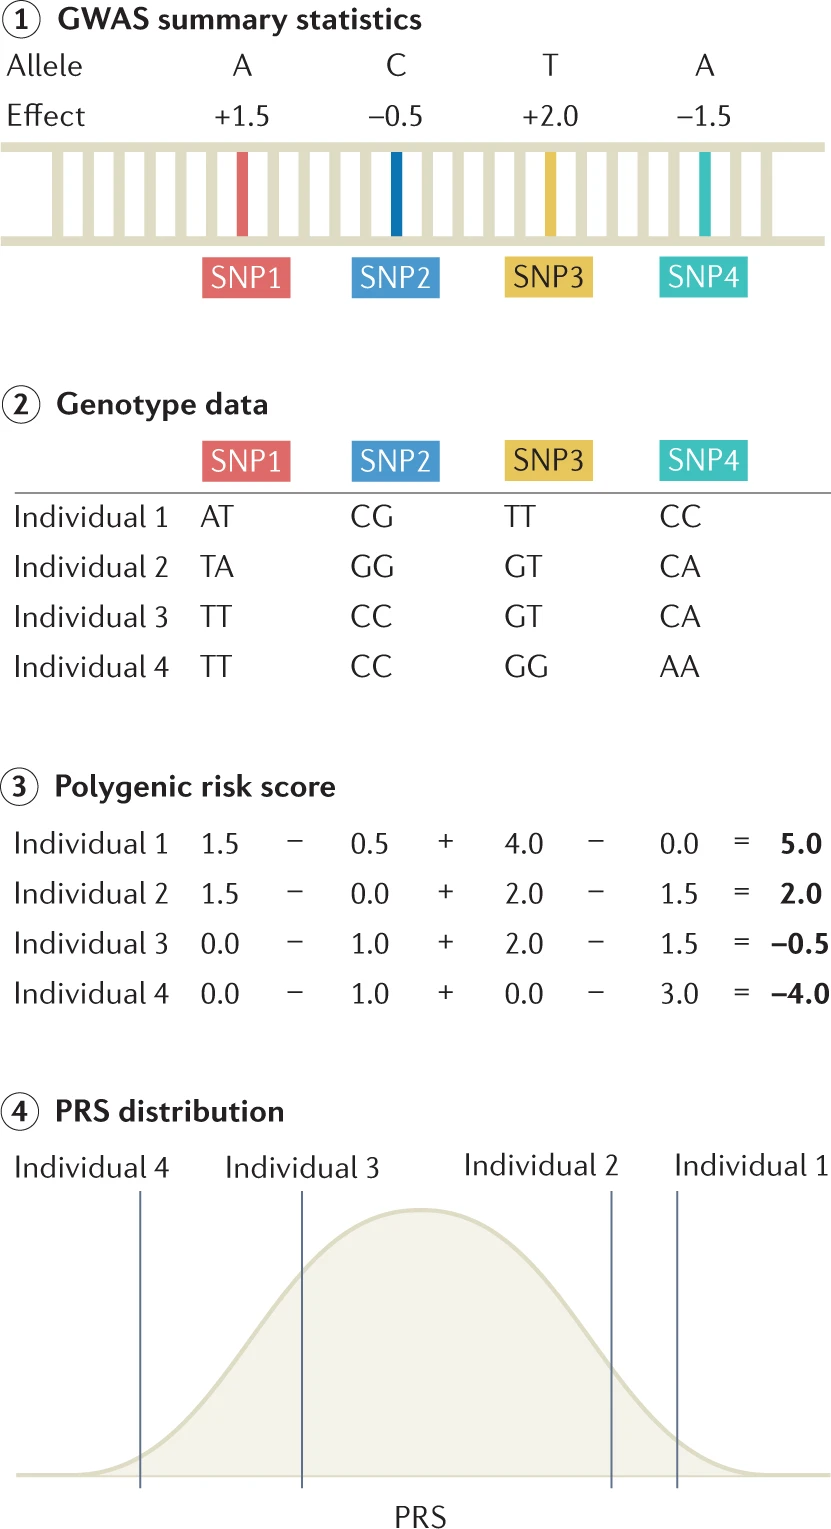
Step 1: genome-wide association studies (GWAS) summary statistics are obtained, which detail the effect of each single-nucleotide polymorphism (SNP) on the phenotype of interest.
Step 2: genotype data for a set of individuals are referenced against GWAS summary statistics. Here, genotype data for four SNPs are shown for four individuals.
Step 3: polygenic risk scores (PRSs) or polygenic scores (PGSs) can be calculated for each individual by summing up the effect sizes of all risk alleles for each individual.
Step 4: linear regression analysis is performed on the calculated PRS to assess the effect of the PRS on the outcome measure.
In this tutorial, we will perform only the first 3 steps. For a proper PRS tutorial with thresholding and finding the "best-fit" PRS please see: https://choishingwan.github.io/PRS-Tutorial/.
Note
Should it be polygenic score (PGS) or polygenic risk score (PRS)? Does the name matter?
The history of nomenclature in this space is extensive and can be so confusing for newcomers! Typically, the term PGS is applied to quantitative traits whereas PRS is used in the context of disease susceptibility. See Kullo et al. 2022 for more details.
PGS in plink
plink provides a convenient function --score and --q-score-range for calculating polygenic scores.
Downloading summary statistics
In this tutorial we will work with summary statistics from UK Biobank GWAS for skin color (data field 1717) from the publicly available release by the Neale Lab (version 3, Manifest Release 20180731). This GWAS measured self-reported skin color as a categorical variable (very fair, fair, light olive, dark olive, brown, black). In this file the reported beta values show estimated effect size of alt allele.
cd ~/gwas_exercises/out

wget https://broad-ukb-sumstats-us-east-1.s3.amazonaws.com/round2/additive-tsvs/1717.gwas.imputed_v3.both_sexes.tsv.bgz -O 1717.gwas.imputed_v3.both_sexes.tsv.bgz
We will also download file contains annotations for each variant in the GWAS.
wget https://broad-ukb-sumstats-us-east-1.s3.amazonaws.com/round2/annotations/variants.tsv.bgz -O variants.tsv.bgz
The order of variants in variants.tsv file matches the order of variants in the 1717.gwas.imputed_v3.both_sexes.tsv file. To join these annotations with a results file, we can either match on the "variant" field or simply paste the columns together (and extract from each file only columns relevant for us) e.g.
paste <(zcat variants.tsv.bgz | cut -f5,6) <(zcat 1717.gwas.imputed_v3.both_sexes.tsv.bgz | cut -f8,11) | awk '{print $2,$1,$3,$4}' > skincolor.tsv
QC summary statistics
We will extract only unique SNPs present in 1KGP from summary statistics.
echo -e "rsid\talt\tbeta\tpval" > skincolor_QC.tsv

grep -wf <(cut -f2 ../data/1kgp.bim) skincolor.tsv | awk '!seen[$1]++' >> skincolor_QC.tsv
Clumping
To identify genome-wide significant and independent SNPs, we will performe clumping using plink with 1000 Genomes Project as an LD reference panel.
And then performe clumping.
plink \
    --bfile ../data/1kgp \
    --clump skincolor_QC.tsv \
    --clump-p1 5.0e-8 \
    --clump-r2 0.5 \
    --clump-kb 100 \
    --clump-snp-field rsid \
    --clump-field pval \
    --out 1kgp
This will generate 1kgp.clumped file, containing the index SNPs after clumping is performed. We can extract the index SNP ID by performing the following command ($3 because the third column contains the SNP ID):
awk 'NR!=1{print $3}' 1kgp.clumped > 1kgp.clumped.snp
PGS calculation
plink \
    --bfile ../data/1kgp \
    --score skincolor_QC.tsv 1 2 3 sum header \
    --extract 1kgp.clumped.snp \
    --out pgs_1kgp
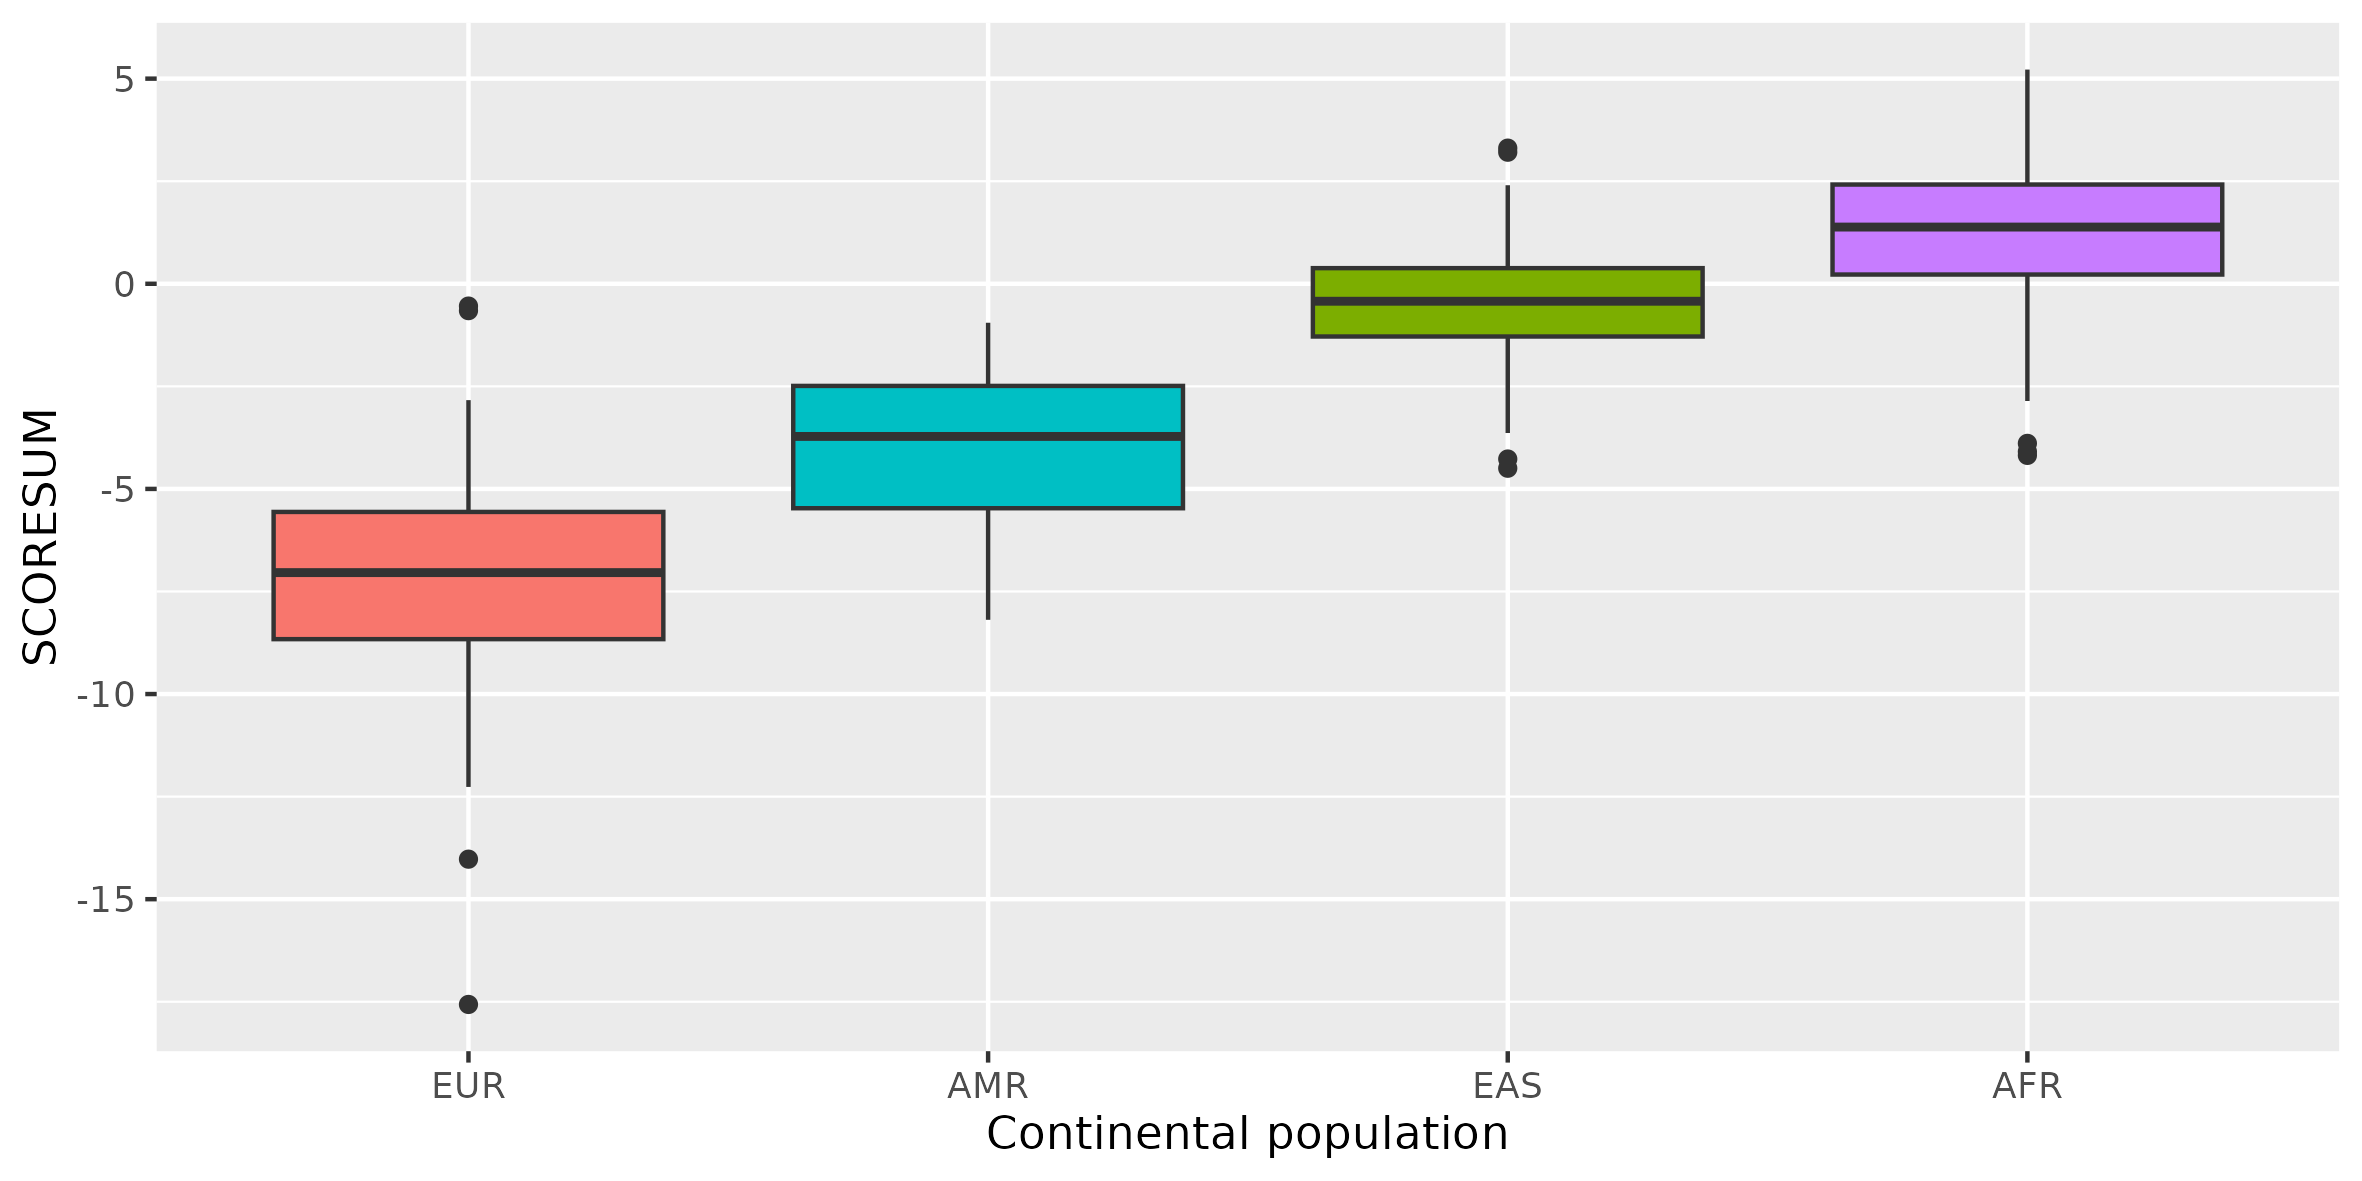
We can quickly sort based on the predicted value and see that there seem to be a geographic pattern. EUR samples tend to have lower values while AFR samples have higher values.
sort -gk 6 pgs_1kgp.profile
Homework
By default, if a genotype in the plink's --score is missing for a particular individual, then the expected value is imputed, i.e. based on the sample allele frequency. To change this behavior, we can add the flag --score-no-mean-imputation. Calculate PGS as above but this time add --score-no-mean-imputation and compare the results.
Since we do not have a dataset (independent from the discovery panel) with phenotypes we will not perform all the steps necessary for proper calculation of PGS. However, we can compare PGS scores across world populations. Still, we have to be aware that PRS are more accurate in European populations (in those that are better covered with GWAS), and thus we have to be careful when interpreting those results.
We can use R to inspect how this PGS is distributed across world populations.
Rscript --vanilla ../scripts/plot_pgs.R
Note
PRS available today are several times more accurate in individuals of European ancestry than other ancestries. This disparity is an inescapable consequence of Eurocentric biases in GWAS (Martin et al. 2019).